Meso-scale Modeling

Meso-scale Modeling

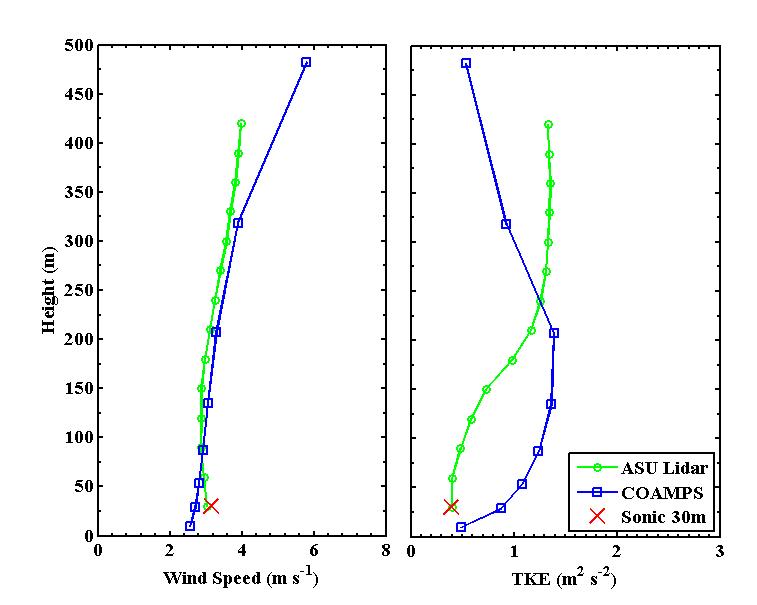
                              ERSG have also compared results from various meso-scale models (such as COAMPS and WRF) to lidar and tower data.  Several parameters were analyzed and compared.  Some initial results are provided below.  Please refer Krishnamurthy et al. 2011 for further details.  More results to come soon.


Figure: (a) Wind speed and (b) TKE comparison between ASU lidar (dashed line) at 1800 UTC, COAMPS at 2000 UTC (solid line) and sonic at 30 m on ISFF tower at 1800 UTC (cross) on 27 March 2006. (Krishnamurthy et al. 2011)
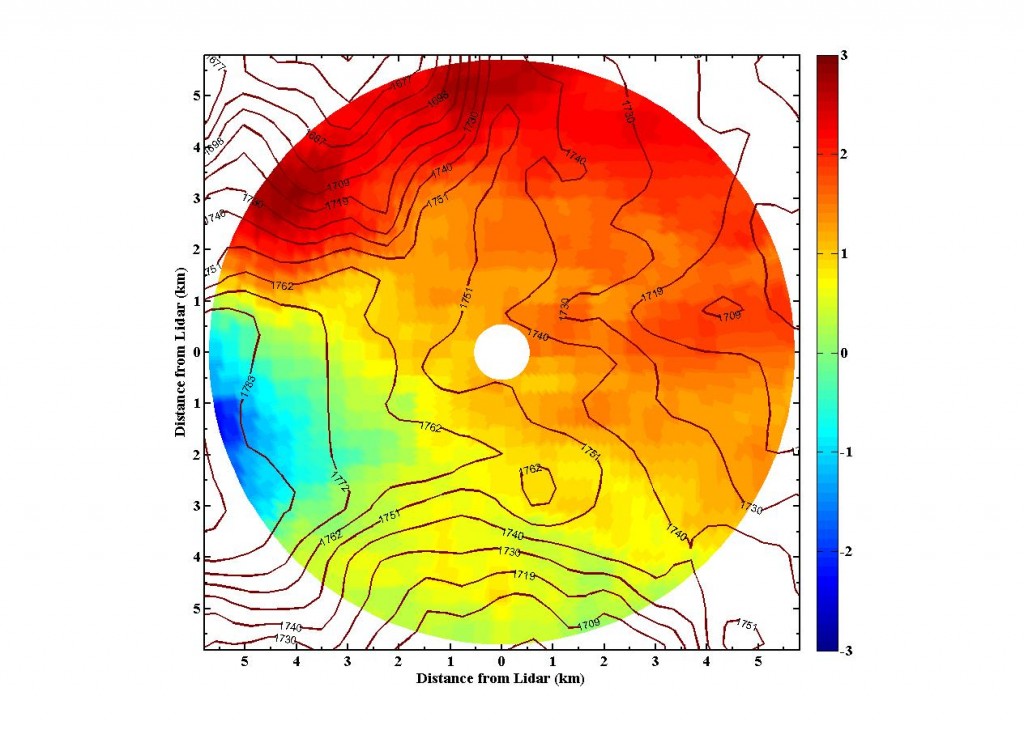
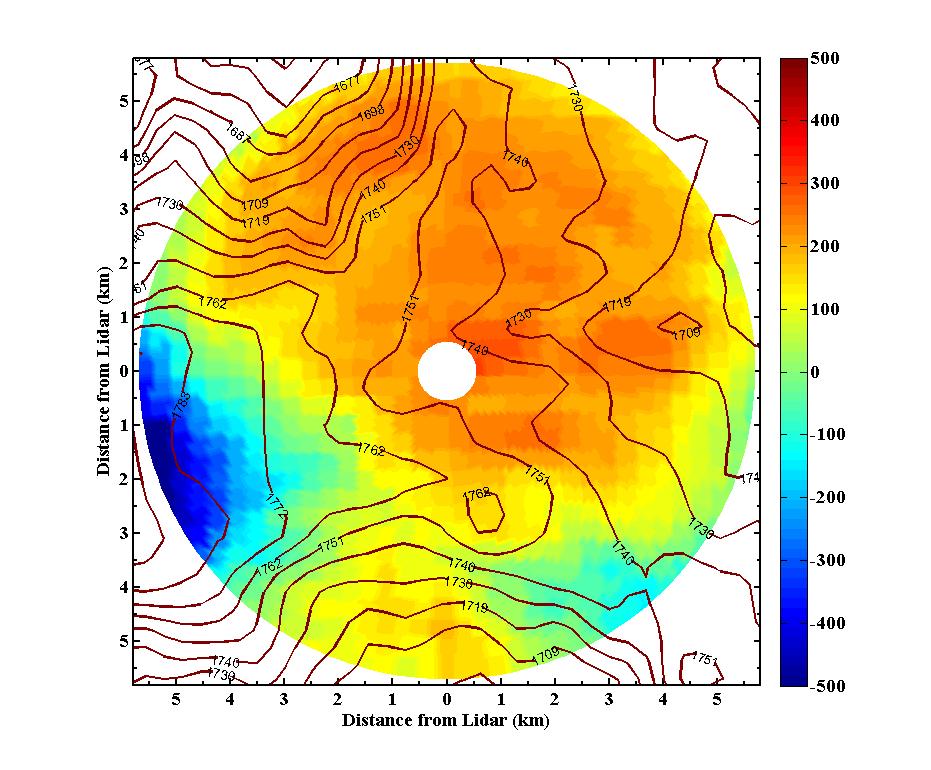
Figure: Spatial map of mean wind speed (ms-1) difference between lidar and COAMPS simulation for the period of observation (Lidar minus COAMPS).  The contour lines show terrain height.Figure: Spatial map of mean power (kW) difference between lidar and COAMPS simulation for the period of observation (Lidar minus COAMPS).  The contour lines show terrain height. (Krishnamurthy 2012)

Remote Sensing for Wind Energy